Your dedicated Business
Intelligence Team
Pause or cancel anytime.
A full-stack data team at your fingertips. Unlimited requests, rapid delivery, and no hiring headaches.
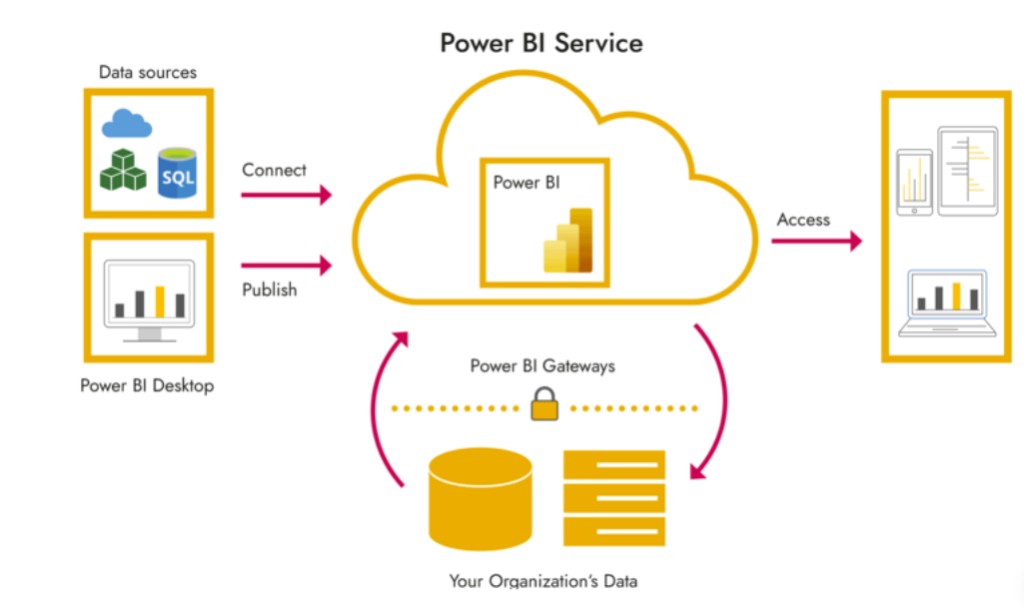
We primarily work with Microsoft Power BI / Fabric, and we can also adapt to your existing tech stack when needed.
All Your Data in One Dashboard
Connect CRM, ERP, Finance, Marketing & more
No More Manual Work
Fully automated, real-time insights
Custom Dashboards for Your Business
Actionable KPIs & AI-driven
forecasts
BI Without Hiring Costs
A full analytics team at a fraction of the price


Get Business Insights in Real-Time – No More Manual Reporting!
Get Business Insights in Real-Time – No More Manual Reporting!
Lack of Visibility into Customer Behavior & Retention
The Problem: Without deep customer analytics, businesses struggle to understand buying patterns, reduce churn, and personalize marketing.
The Solution: We provide RFM analysis, customer segmentation, and retention tracking so you can increase lifetime value (LTV) and customer loyalty.
Missed Revenue Due to Inventory & Supply Chain Issues
The Problem: Stockouts, overstocking, and supply chain inefficiencies lead to lost sales and wasted resources.
The Solution: Our real-time inventory & logistics dashboards optimize stock levels, purchasing decisions, and supplier performance.
Compliance Risks & Audit
Challenges
The Problem: Manual tracking of financial transactions, expenses, and legal requirements increases the risk of errors and regulatory penalties.
The Solution: Our automated compliance reports and audit tracking ensure accurate financial reporting with zero errors.
No Competitive Benchmarking or Industry Comparisons
The Problem: Companies lack visibility into competitor performance and market benchmarks, making it hard to identify growth opportunities.
The Solution: We provide competitive analysis and industry benchmarking to help you outperform competitors and maximize market share.
How Our BI Dashboards Solve These Challenges
Unify all your data sources into one place
Reduce costs with a subscription-based BI model
Automate reporting & eliminate manual work
Help you make faster, data -driven business decisions
Provide real-time & AI-driven insights
Secure data with role-based access & compliance.
Reports & Dashboard examples
Meta Ads Dashboard
Maximize ROI & Simplify Ad Performance Tracking

Meta Ads Dashboard
Maximize ROI & Simplify Ad Performance Tracking

Project Management Dashboard
Optimize Budgets & Efficiency

Google Ads Performance Dashboard
Optimize Ad Spend & ROAS
.png)
Leads Dashboard
Optimize Lead Conversion and Improve Sales Efficiency

Sales Dashboard
Unlock Revenue Insights & Boost Performance

Sales Performance Dashboard
Maximize Revenue & Track Key Metrics

Chargeback Monitoring Dashboard
Track & Reduce Disputes

Finance & Budget Dashboard
Gain Full Control Over Your Financials

Finance & Profit Dashboard – Track Cash Flow,
Revenue, and Profitability

Finance & Profit Dashboard – Track Cash Flow,
Revenue, and Profitability

Finance & Budget Dashboard
Gain Full Control Over Your Financials

Finance & Profit Dashboard – Track Cash Flow,
Revenue, and Profitability

Finance & Budget Dashboard
Gain Full Control Over Your Financials

The Smarter Alternative – BI as a Service
Instead of hiring, training, and managing a full BI team, you can outsource your analytics for a fraction of the cost.
Option
Monthly Cost
Annual Cost
Savings vs. In-House
In-House BI Team
~$37,000
~$444,000
0
BI Subscription
$2,995
$35,940
Savings: ~$408,000/year (92%)
Forget the hassle of hiring—focus on growing your business!


Didn’t see your system? No worries – we’ll integrate it for you!
Data Never Gets Lost
Using reliable Microsoft solutions, we ensure the safety and confidentiality of your data.
One subscription,
endless possibilities

Join
KPI BOARD
Monthly Club

Pause anytime
Temporarily pause your subscription anytime, no sweat.
Try it for a week
Not loving it after a week? Get 75% back, no questions asked.
Microsoft Fabric / Power BI, and per-user licenses are not included in the price above.
Our Dashboards & Solutions
Our Clients


Years 2020-2021
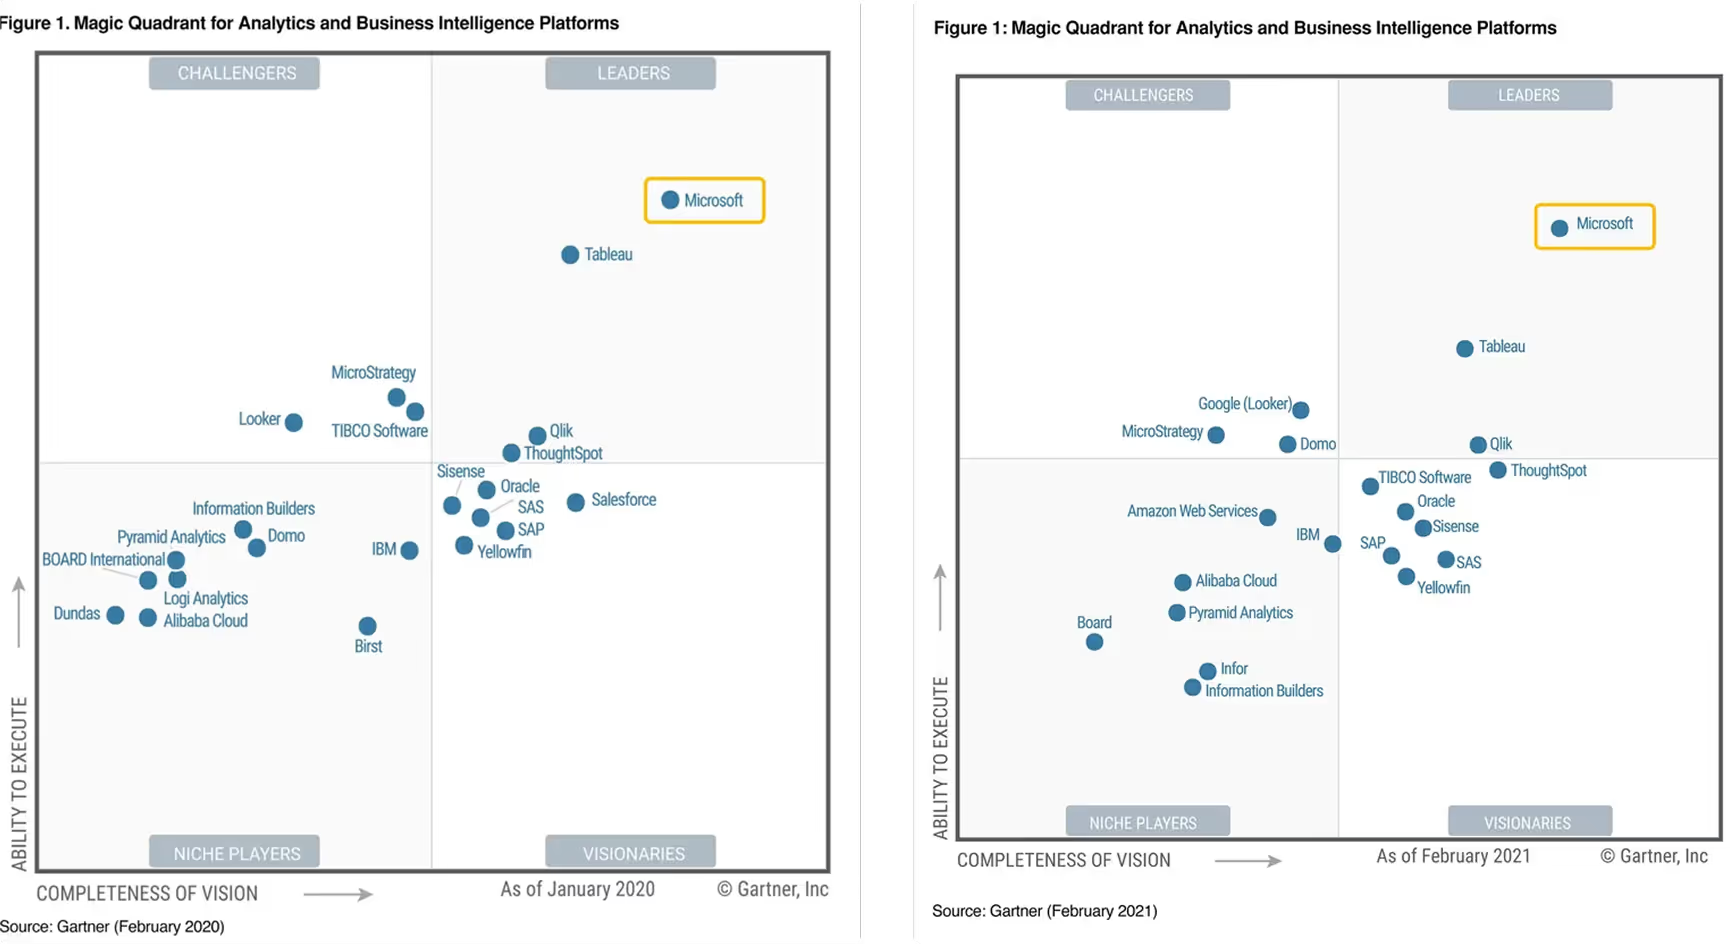
Years 2022-2023
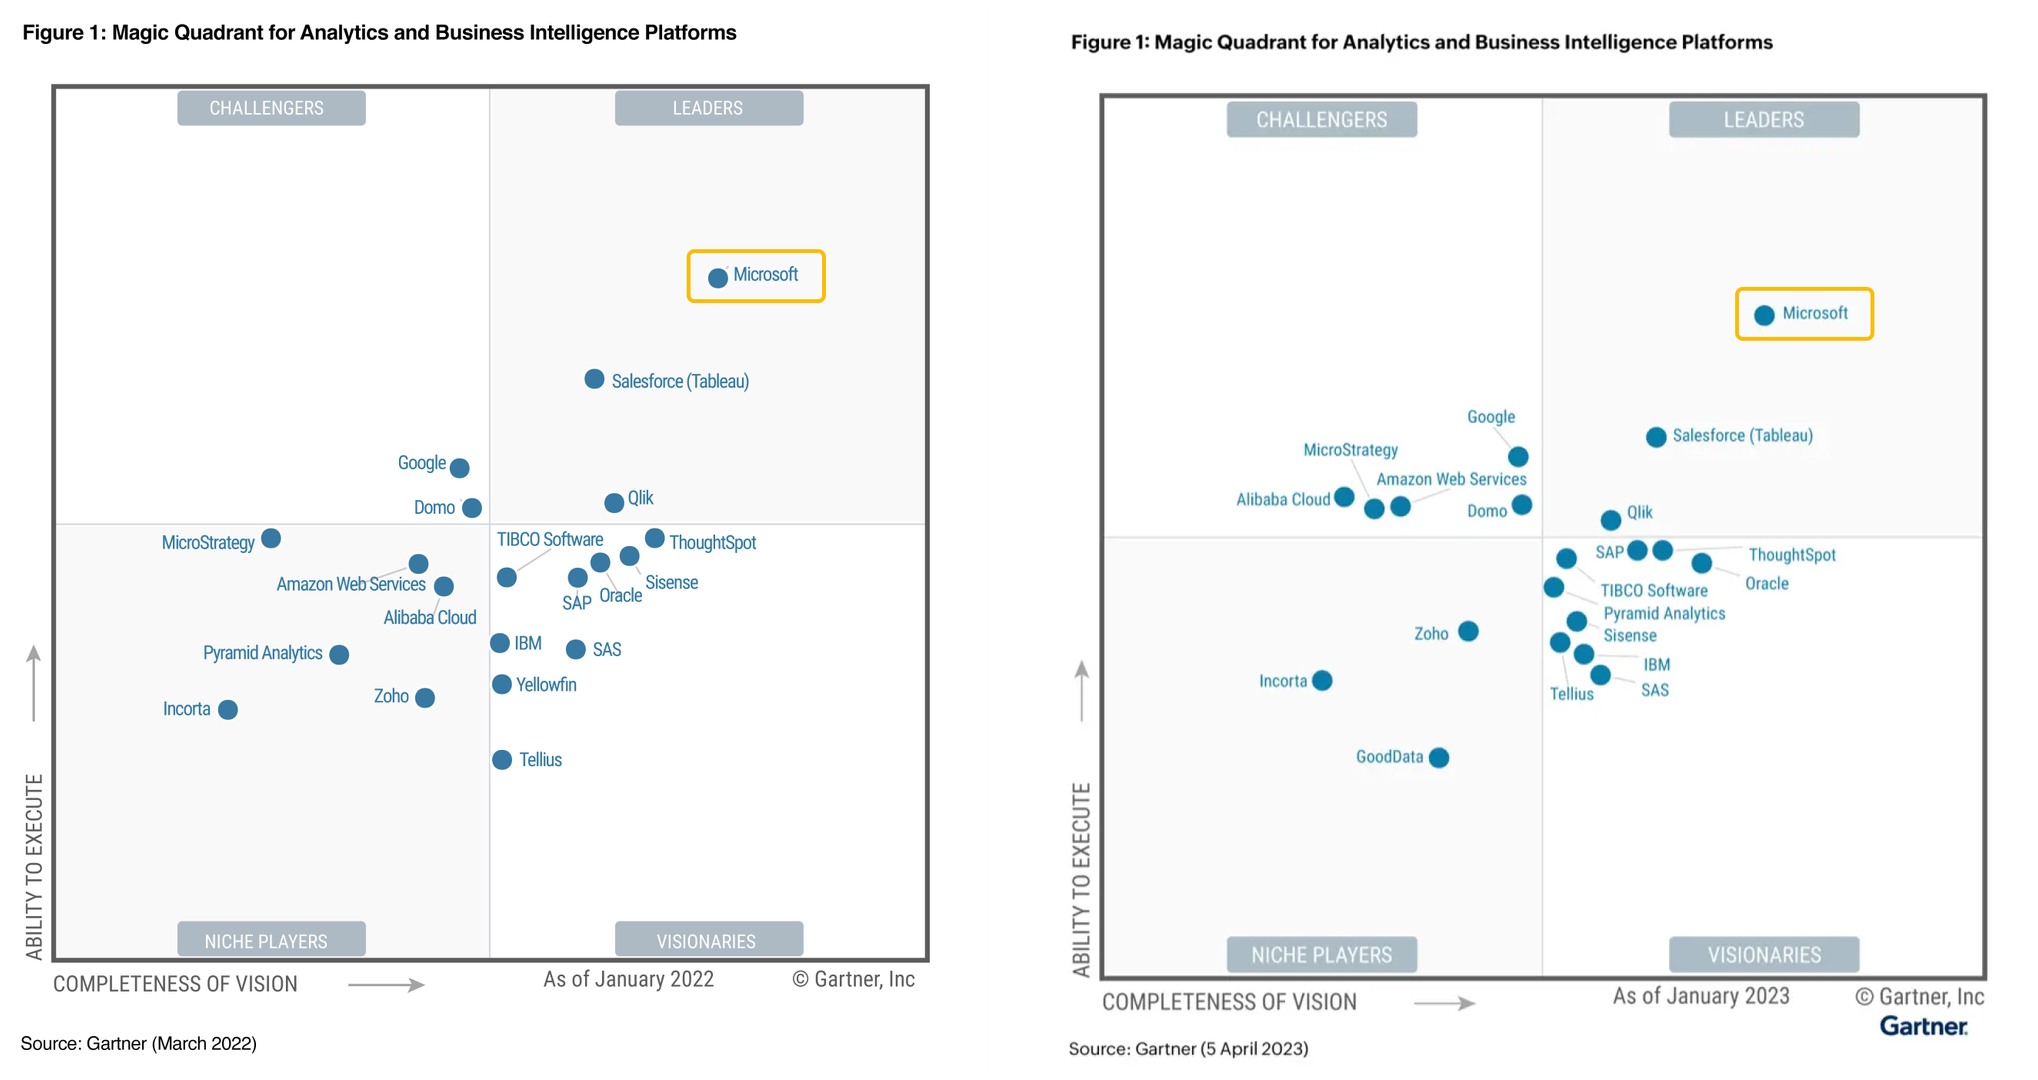
Years 2024-2025
Frequently Asked Questions
Book a Free Consultation
📅 Want to see how our dashboards work?
Book a demo with our experts
