Grow your business with Dashboards
Tired of scattered reports and manual data analysis?
Your data holds the answers—
if only you could access them in real time.
Manual reporting wastes hours, causes errors, and slows growth.
All Your Data in One Dashboard
Connect CRM, ERP, Finance, Marketing & more
No More Manual Work
Fully automated, real-time insights
Custom Dashboards for Your Business
Actionable KPIs & AI-driven
forecasts
BI Without Hiring Costs
A full analytics team at a fraction of the price


Get Business Insights in Real-Time – No More Manual Reporting!
Lack of Visibility into Customer Behavior & Retention
The Problem: Without deep customer analytics, businesses struggle to understand buying patterns, reduce churn, and personalize marketing.
The Solution: We provide RFM analysis, customer segmentation, and retention tracking so you can increase lifetime value (LTV) and customer loyalty.
Missed Revenue Due to Inventory & Supply Chain Issues
The Problem: Stockouts, overstocking, and supply chain inefficiencies lead to lost sales and wasted resources.
The Solution: Our real-time inventory & logistics dashboards optimize stock levels, purchasing decisions, and supplier performance.
Compliance Risks & Audit
Challenges
The Problem: Manual tracking of financial transactions, expenses, and legal requirements increases the risk of errors and regulatory penalties.
The Solution: Our automated compliance reports and audit tracking ensure accurate financial reporting with zero errors.
No Competitive Benchmarking or Industry Comparisons
The Problem: Companies lack visibility into competitor performance and market benchmarks, making it hard to identify growth opportunities.
The Solution: We provide competitive analysis and industry benchmarking to help you outperform competitors and maximize market share.
How Our BI Dashboards Solve These Challenges
Unify all your data sources into one place
Reduce costs with a subscription-based BI model
Automate reporting & eliminate manual work
Help you make faster, data -driven business decisions
Provide real-time & AI-driven insights
Secure data with role-based access & compliance.
Reports & Dashboard examples
Meta Ads Dashboard
Maximize ROI & Simplify Ad Performance Tracking

Meta Ads Dashboard
Maximize ROI & Simplify Ad Performance Tracking

Project Management Dashboard
Optimize Budgets & Efficiency

Google Ads Performance Dashboard
Optimize Ad Spend & ROAS
.png)
Leads Dashboard
Optimize Lead Conversion and Improve Sales Efficiency

Sales Dashboard
Unlock Revenue Insights & Boost Performance

Sales Performance Dashboard
Maximize Revenue & Track Key Metrics

Chargeback Monitoring Dashboard
Track & Reduce Disputes

Finance & Budget Dashboard
Gain Full Control Over Your Financials

Finance & Profit Dashboard – Track Cash Flow,
Revenue, and Profitability

Finance & Profit Dashboard – Track Cash Flow,
Revenue, and Profitability

Finance & Budget Dashboard
Gain Full Control Over Your Financials

Finance & Profit Dashboard – Track Cash Flow,
Revenue, and Profitability

Finance & Budget Dashboard
Gain Full Control Over Your Financials

The Smarter Alternative – BI as a Service
Instead of hiring, training, and managing a full BI team, you can outsource your analytics for a fraction of the cost.
Option
Monthly Cost
Annual Cost
Savings vs. In-House
In-House BI Team
~$37,000
~$444,000
0
BI Subscription (Starter)
$3,000
$36,000
Savings: ~$408,000/year (92%)
BI Subscription (Professional Plan)
$5,000
$60,000
Savings: ~$384,000/year (86%)
BI Subscription (Advanced Plan)
$8,500
$102,000
Savings: ~$342,000/year (77%)
BI Subscription (Enterprise Plan)
$15,000
$180,000
Savings: ~$264,000/year (59%)
Forget the hassle of hiring—focus on growing your business!


Didn’t see your system? No worries – we’ll integrate it for you!
Feature
Starter
(Small Businesses & Startups)
Professional (Growing
Companies)
Advanced
(Large
Enterprises)
Enterprise
(Custom
Solutions)
Monthly Price
$3,000
$5,500
$10,000
$20,000
BI Platforms
Looker Studio,
MS Power BI & Fabric
Looker Studio,
MS Power BI & Fabric
Looker Studio,
MS Power BI & Fabric
Looker Studio,
MS Power BI & Fabric
Revisions
Unlimited
Unlimited
Unlimited
Unlimited
Data Sources
Up to 3
Up to 20
Up to 20
Unlimited
Users
Up to 3
Up to 10
Up to 20
Up to 100
Dashboards
Up to 3
Up to 20
Up to 30
Unlimited
Storage
Up to 1GB
Up to 3GB
Up to 10GB
Dedicated Azure Data Lake
Data Refresh
Weekly
Every 4 hours
Every 1 hour
Real-Time
Customization
Custom
Styling & Branding
UI/UX Optimized
Bespoke + Designers
Task Management
1 request
3 requests
Dedicated PM
Custom
ETL & Processing
Basic
Advanced
Advanced + AI
Advanced + AI
Support
Email, Slack
(48h)
Slack, Zoom
(24h)
Priority
(4h)
VIP Team
Mobile Access
—
✓
Custom
Custom
Alerts & Reports
—
Email, Teams
Multi-channel
Full + AI Detection
BI Features
Filtering, Drill-Down, LFL
Filtering, Drill-Down, LFL
+ What-If Planning
+ Advanced Modeling
API & Integrations
Standard
API Access
Custom API
Enterprise API
Security
Standard
RLS
RLS + OLS
Enterprise
Embedded Analytics
—
Limited
SaaS Apps
Full + Consulting
Consulting
Onboarding
Quarterly
Monthly
Weekly
Feature
Starter
(Small Businesses & Startups)
Professional (Growing
Companies)
Advanced
(Large
Enterprises)
Enterprise
(Custom
Solutions)
Monthly Price
$2,700
$4,950
$9,000
$18,000
BI Platforms
Looker Studio,
MS Power BI & Fabric
Looker Studio,
MS Power BI & Fabric
Looker Studio,
MS Power BI & Fabric
Looker Studio,
MS Power BI & Fabric
Revisions
Unlimited
Unlimited
Unlimited
Unlimited
Data Sources
Up to 3
Up to 20
Up to 20
Unlimited
Users
Up to 3
Up to 10
Up to 20
Up to 100
Dashboards
Up to 3
Up to 20
Up to 30
Unlimited
Storage
Up to 1GB
Up to 3GB
Up to 10GB
Dedicated Azure Data Lake
Data Refresh
Weekly
Every 4 hours
Every 1 hour
Real-Time
Customization
Custom
Styling & Branding
UI/UX Optimized
Bespoke + Designers
Task Management
1 request
3 requests
Dedicated PM
Custom
ETL & Processing
Basic
Advanced
Advanced + AI
Advanced + AI
Support
Email, Slack
(48h)
Slack, Zoom
(24h)
Priority
(4h)
VIP Team
Mobile Access
—
✓
Custom
Custom
Alerts & Reports
—
Email, Teams
Multi-channel
Full + AI Detection
BI Features
Filtering, Drill-Down, LFL
Filtering, Drill-Down, LFL
+ What-If Planning
+ Advanced Modeling
API & Integrations
Standard
API Access
Custom API
Enterprise API
Security
Standard
RLS
RLS + OLS
Enterprise
Embedded Analytics
—
Limited
SaaS Apps
Full + Consulting
Consulting
Onboarding
Quarterly
Monthly
Weekly
Feature
Starter
(Small Businesses & Startups)
Professional (Growing
Companies)
Advanced
(Large
Enterprises)
Enterprise
(Custom
Solutions)
Monthly Price
$2,100
$3,850
$7,000
$14,000
BI Platforms
Looker Studio,
MS Power BI & Fabric
Looker Studio,
MS Power BI & Fabric
Looker Studio,
MS Power BI & Fabric
Looker Studio,
MS Power BI & Fabric
Revisions
Unlimited
Unlimited
Unlimited
Unlimited
Data Sources
Up to 3
Up to 20
Up to 20
Unlimited
Users
Up to 3
Up to 10
Up to 20
Up to 100
Dashboards
Up to 3
Up to 20
Up to 30
Unlimited
Storage
Up to 1GB
Up to 3GB
Up to 10GB
Dedicated Azure Data Lake
Data Refresh
Daily / Weekly
Every 4 hours
Every 1 hour
Real-Time
Customization
Custom
Styling & Branding
UI/UX Optimized
Bespoke + Designers
Task Management
1 request
3 requests
Dedicated PM
Custom
ETL & Processing
Basic
Advanced
Advanced + AI
Advanced + AI
Support
Email, Slack
(48h)
Slack, Zoom
(24h)
Priority
(4h)
VIP Team
Mobile Access
—
✓
Custom
Custom
Alerts & Reports
—
Email, Teams
Multi-channel
Full + AI Detection
BI Features
Filtering, Drill-Down, LFL
Filtering, Drill-Down, LFL
+ What-If Planning
+ Advanced Modeling
API & Integrations
Standard
API Access
Custom API
Enterprise API
Security
Standard
RLS
RLS + OLS
Enterprise
Embedded Analytics
—
Limited
SaaS Apps
Full + Consulting
Consulting
Onboarding
Quarterly
Monthly
Weekly
Summary of Each Plan
For small businesses that need essential analytics, but without mobile dashboard support or advanced features.
Get StartedFor growing companies that need custom dashboards, AI-driven insights, automation, and mobile reporting.
Get StartedSuited for large enterprises needing fully tailored dashboards, advanced AI insights, and priority support.
Get StartedComplete BI service, with real-time analytics, AI insights, a dedicated BI consultant, and enterprise-level security.
Get StartedOur Dashboards & Solutions
Our Clients


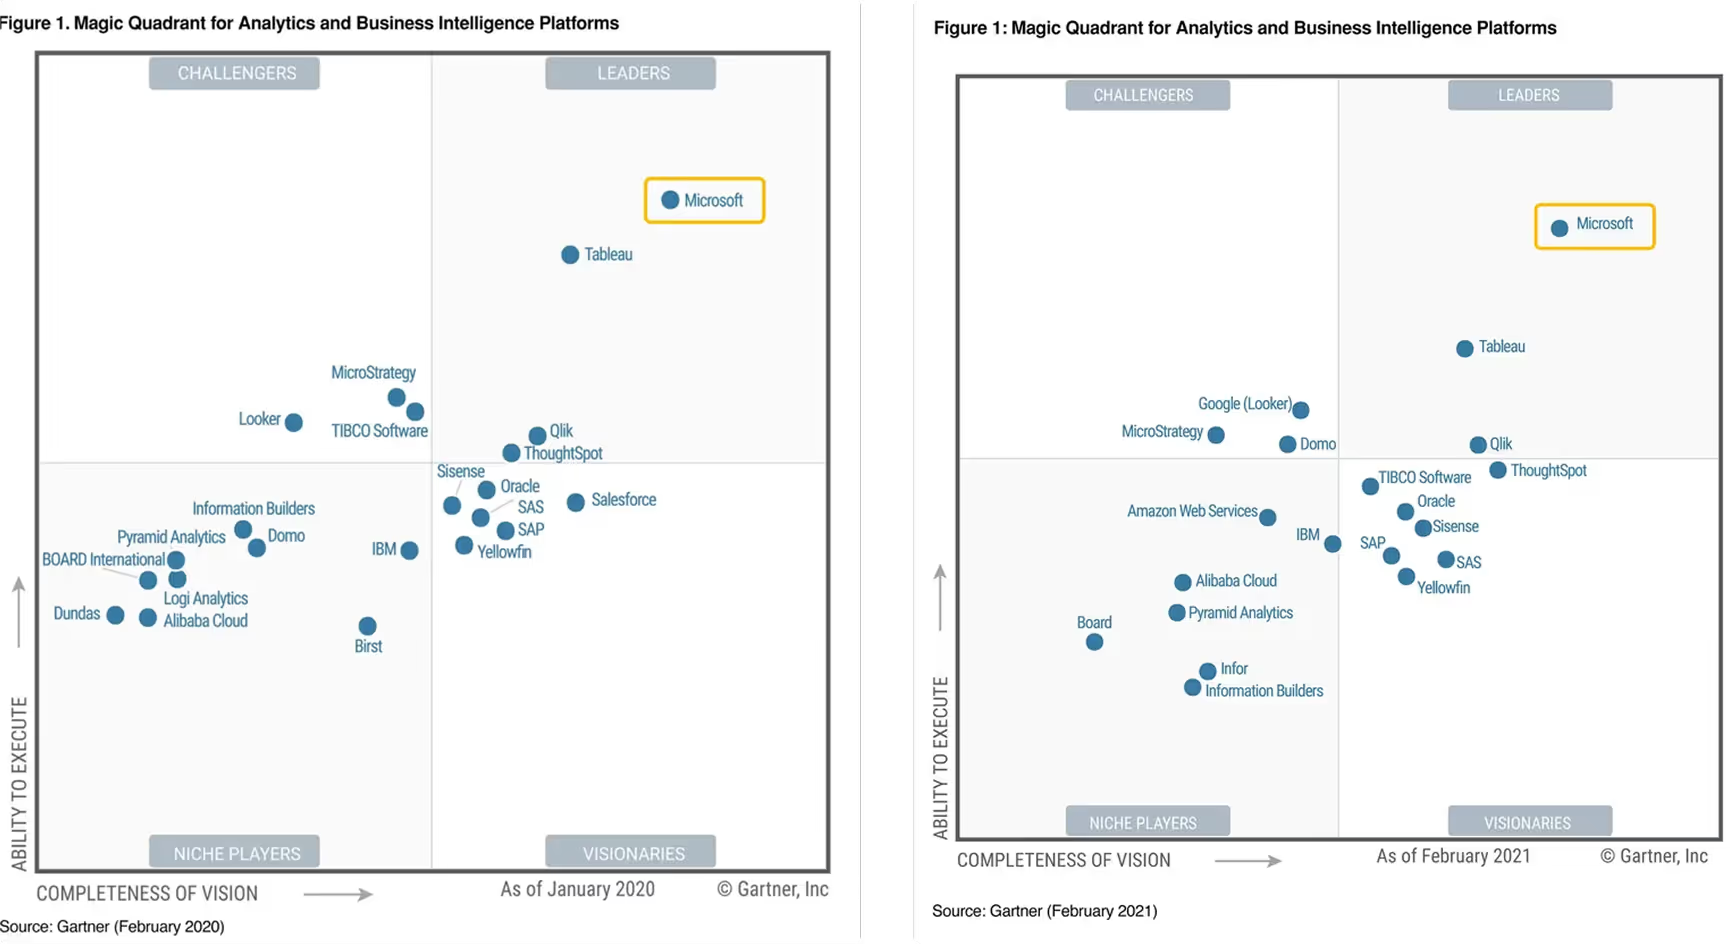
Years 2020-2021
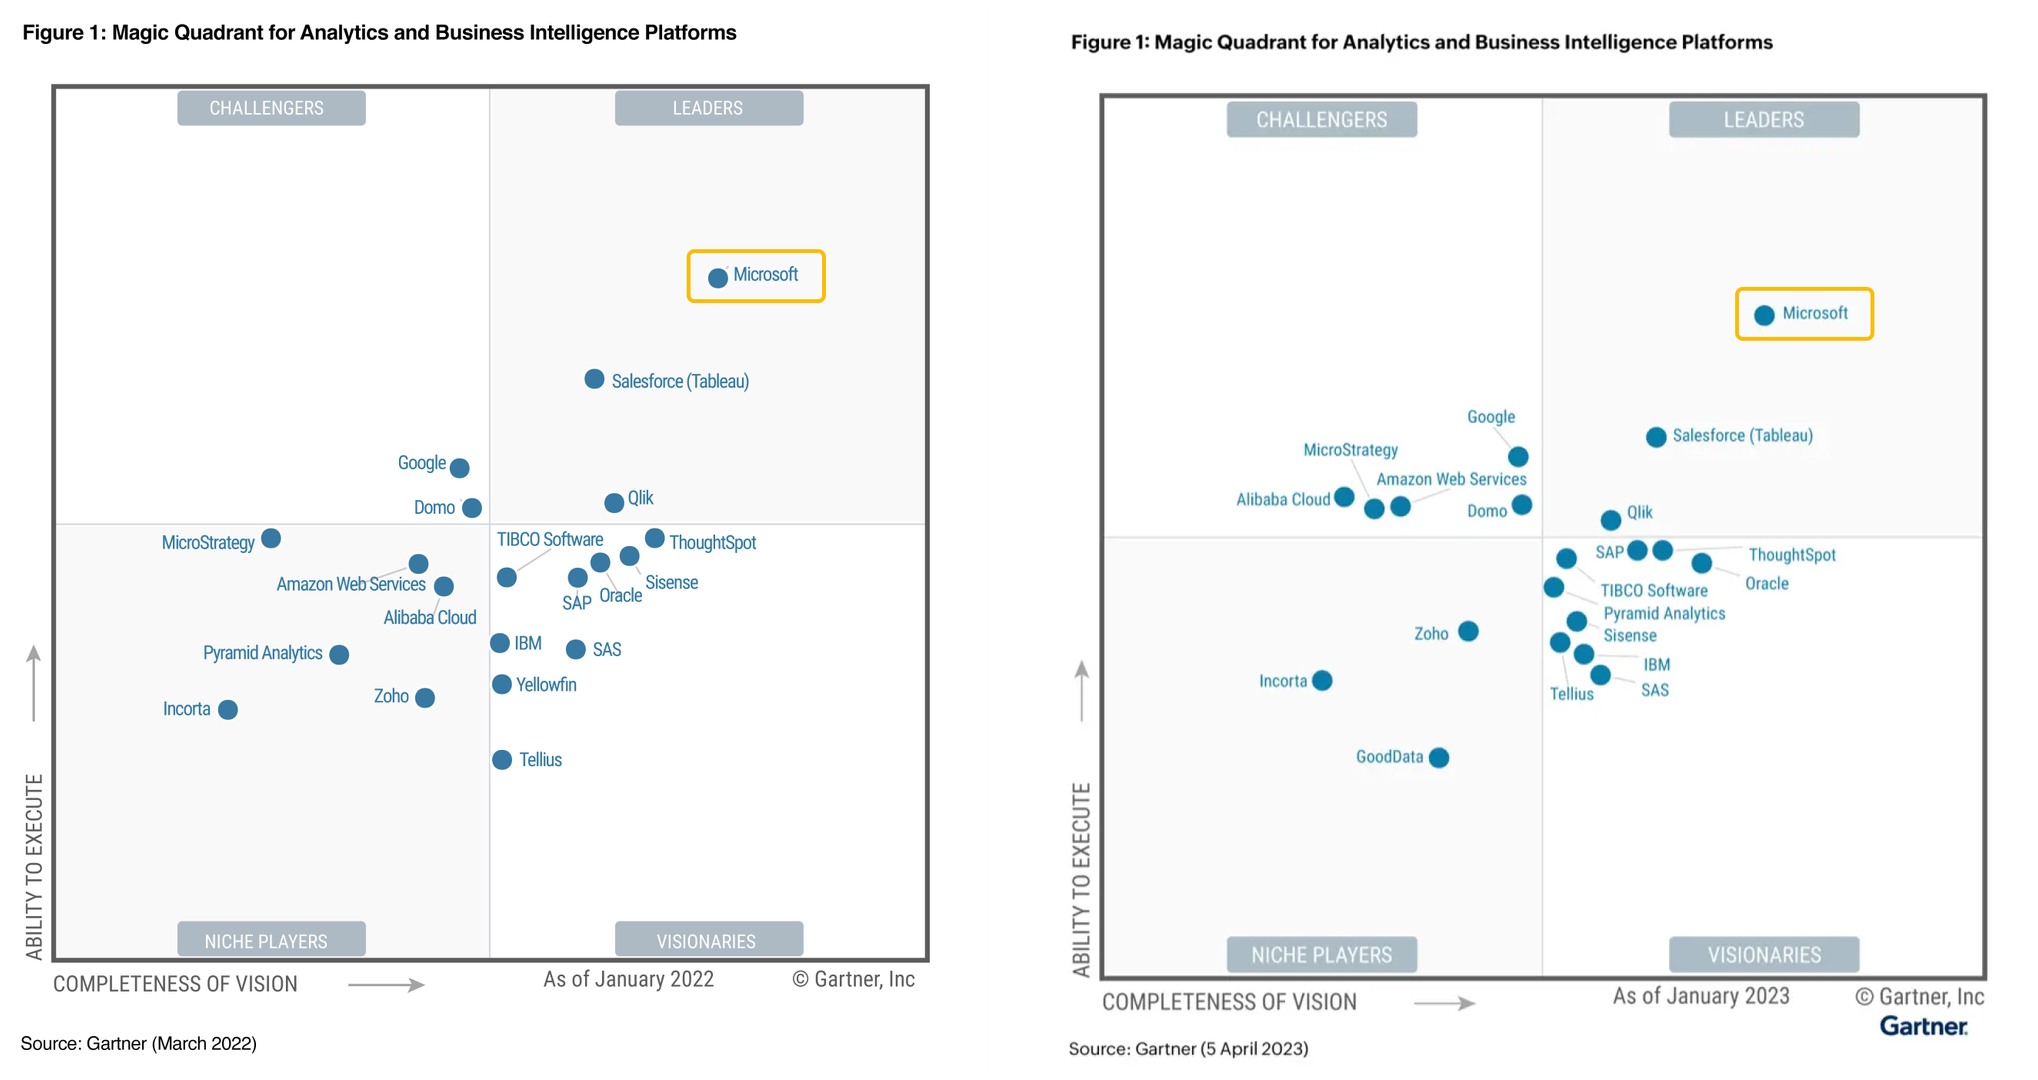
Years 2022-2023
Years 2024-2025

Frequently Asked Questions
Book a Free Consultation
📅 Want to see how our dashboards work?
Book a demo with our experts
